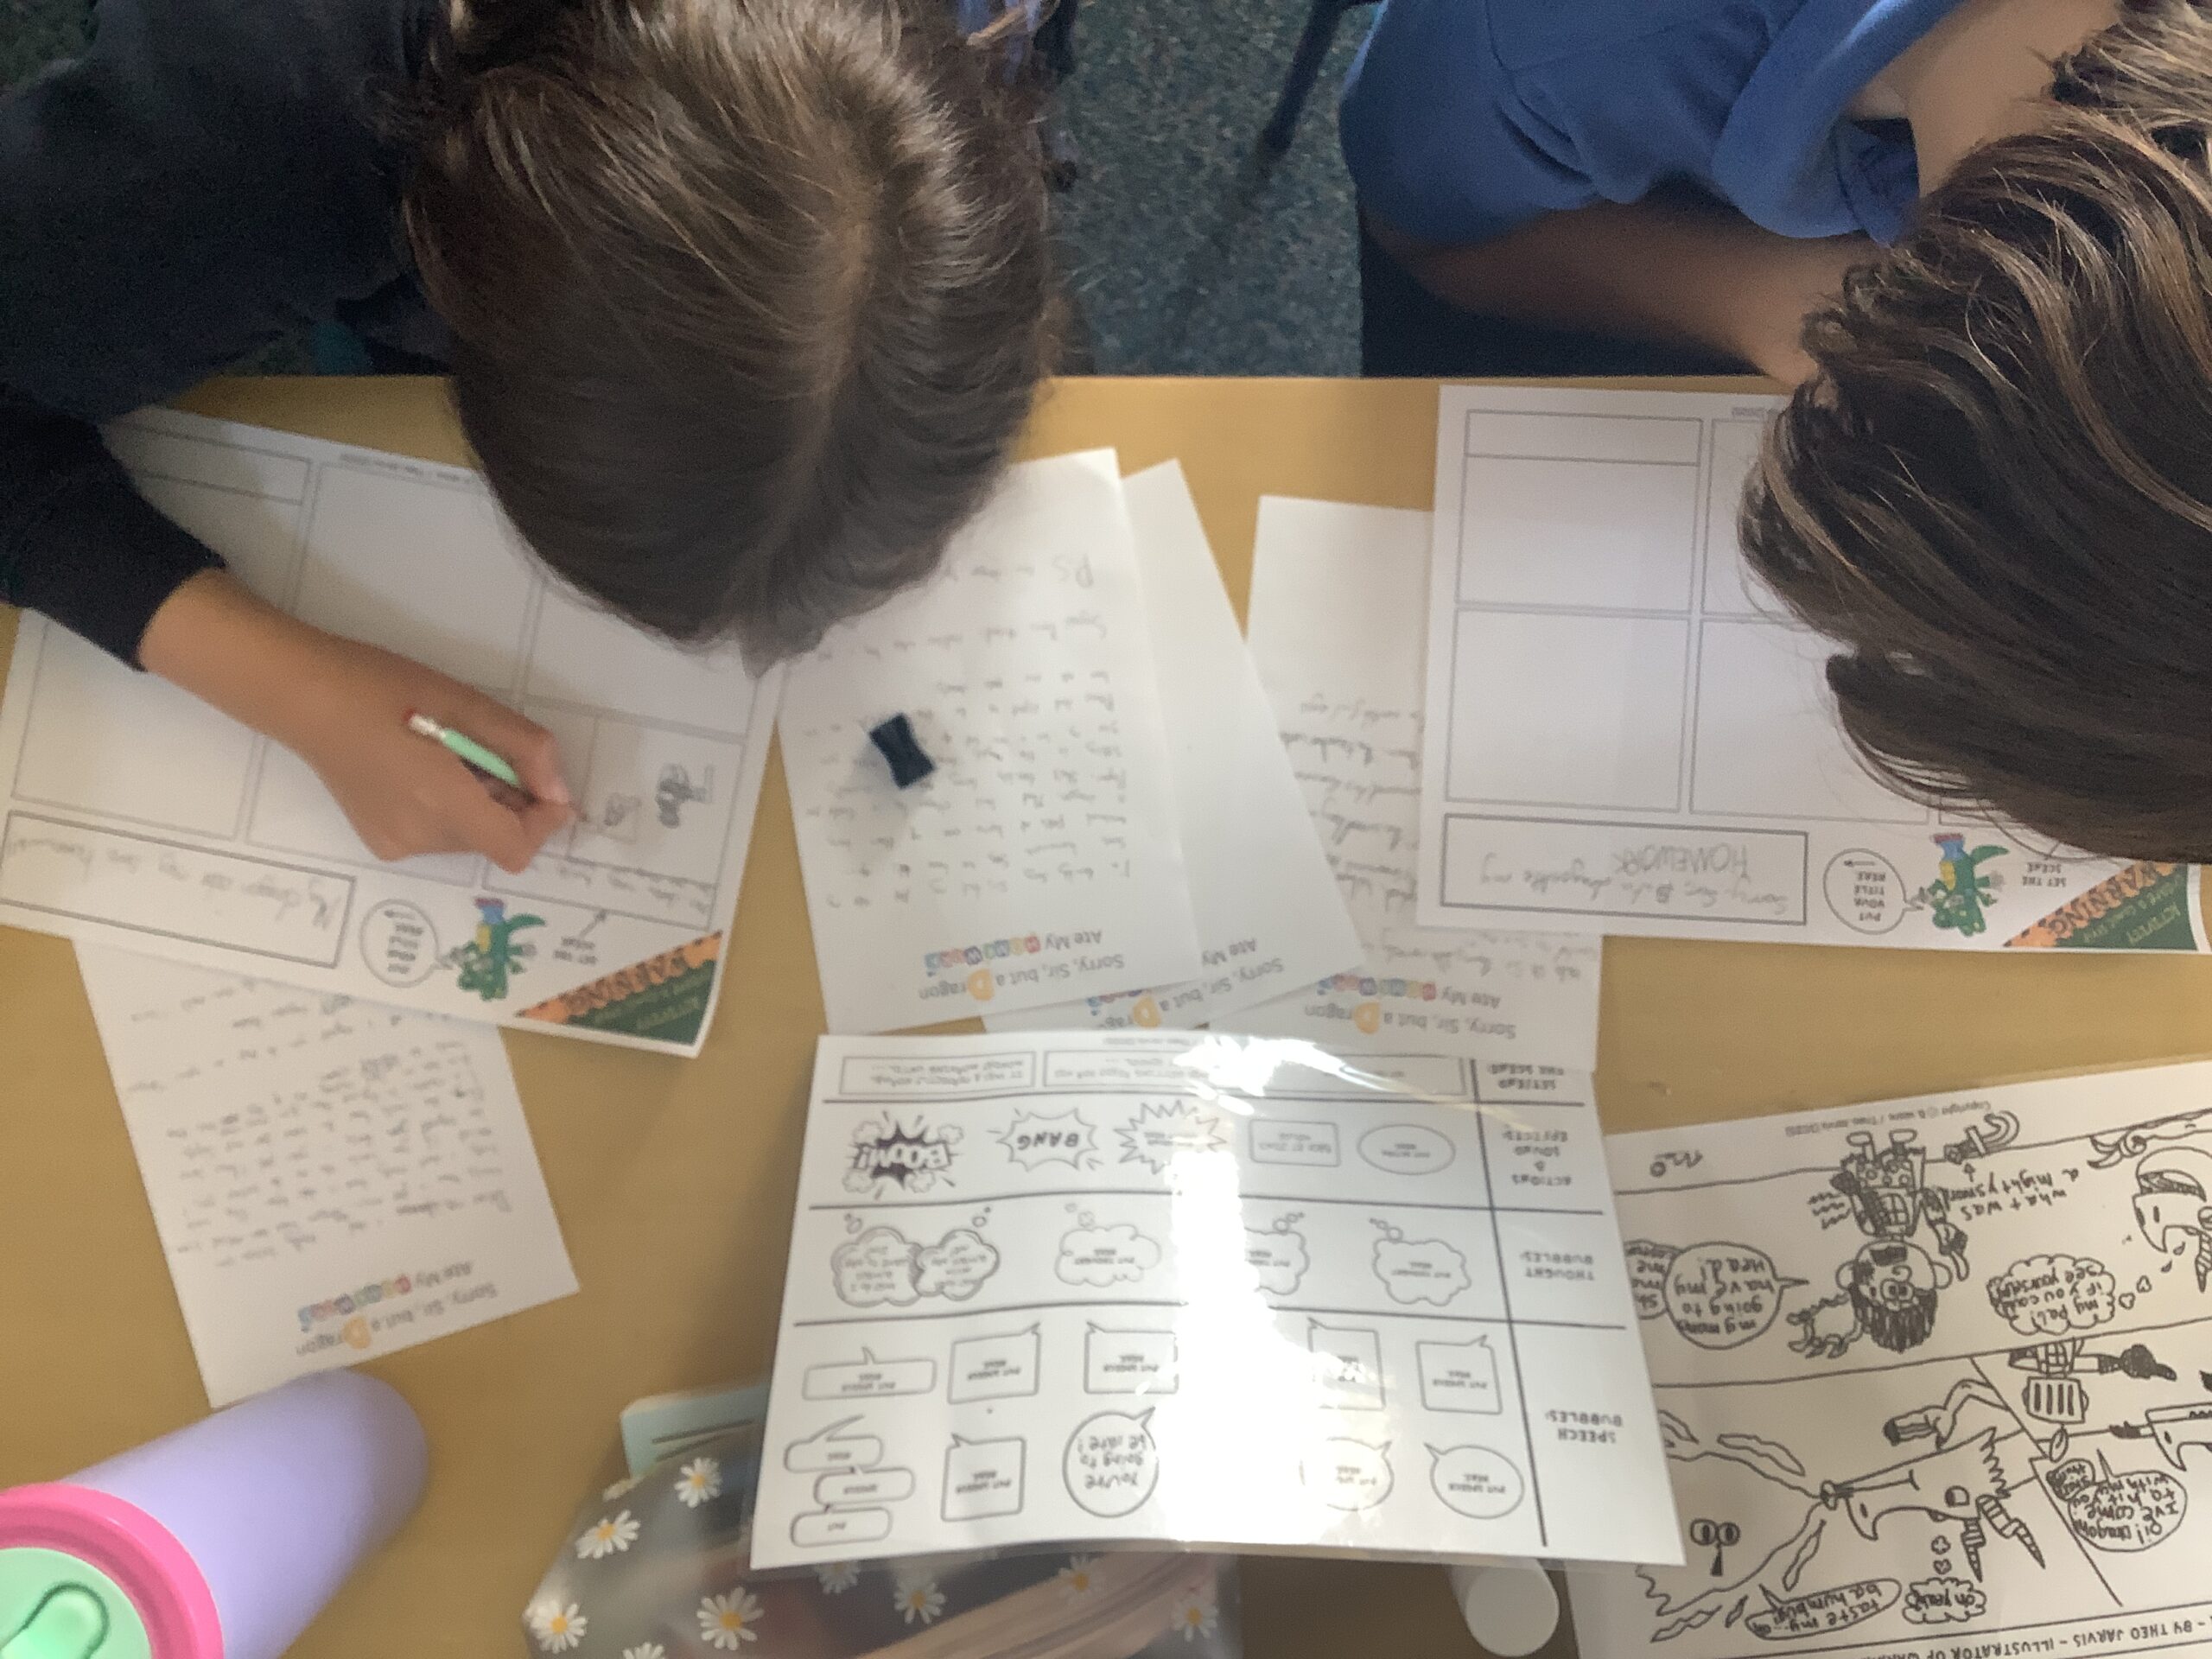
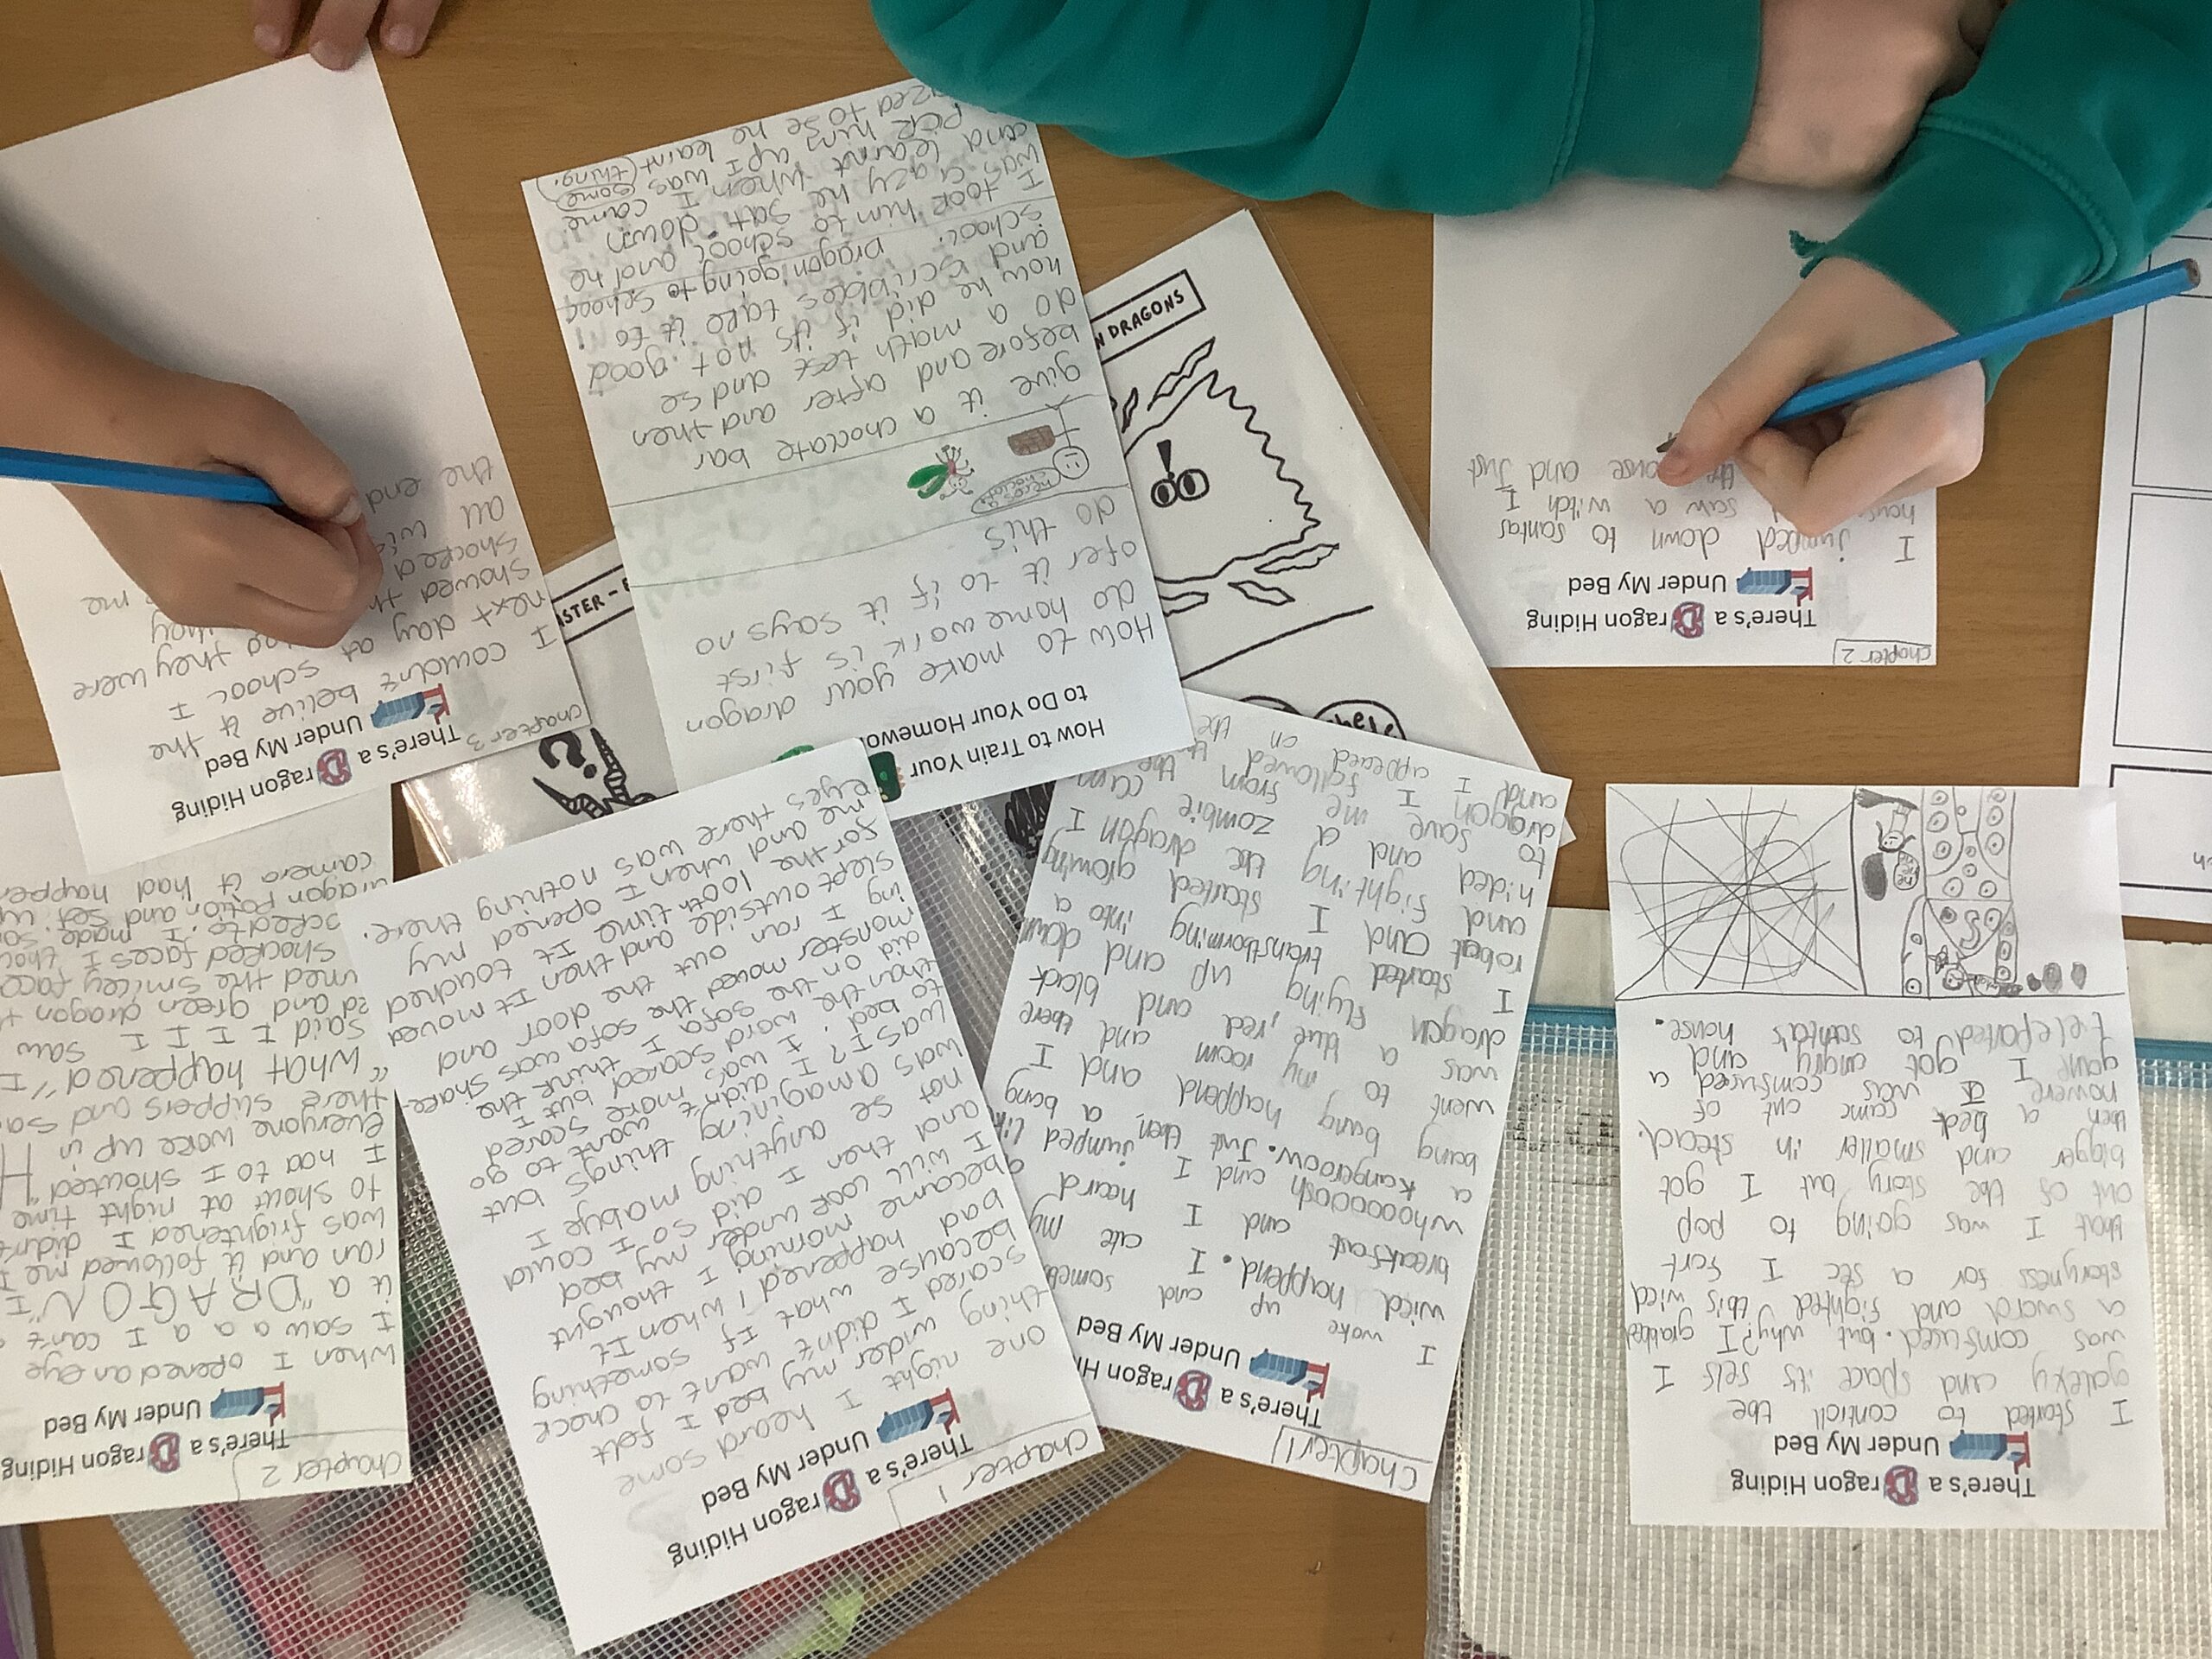
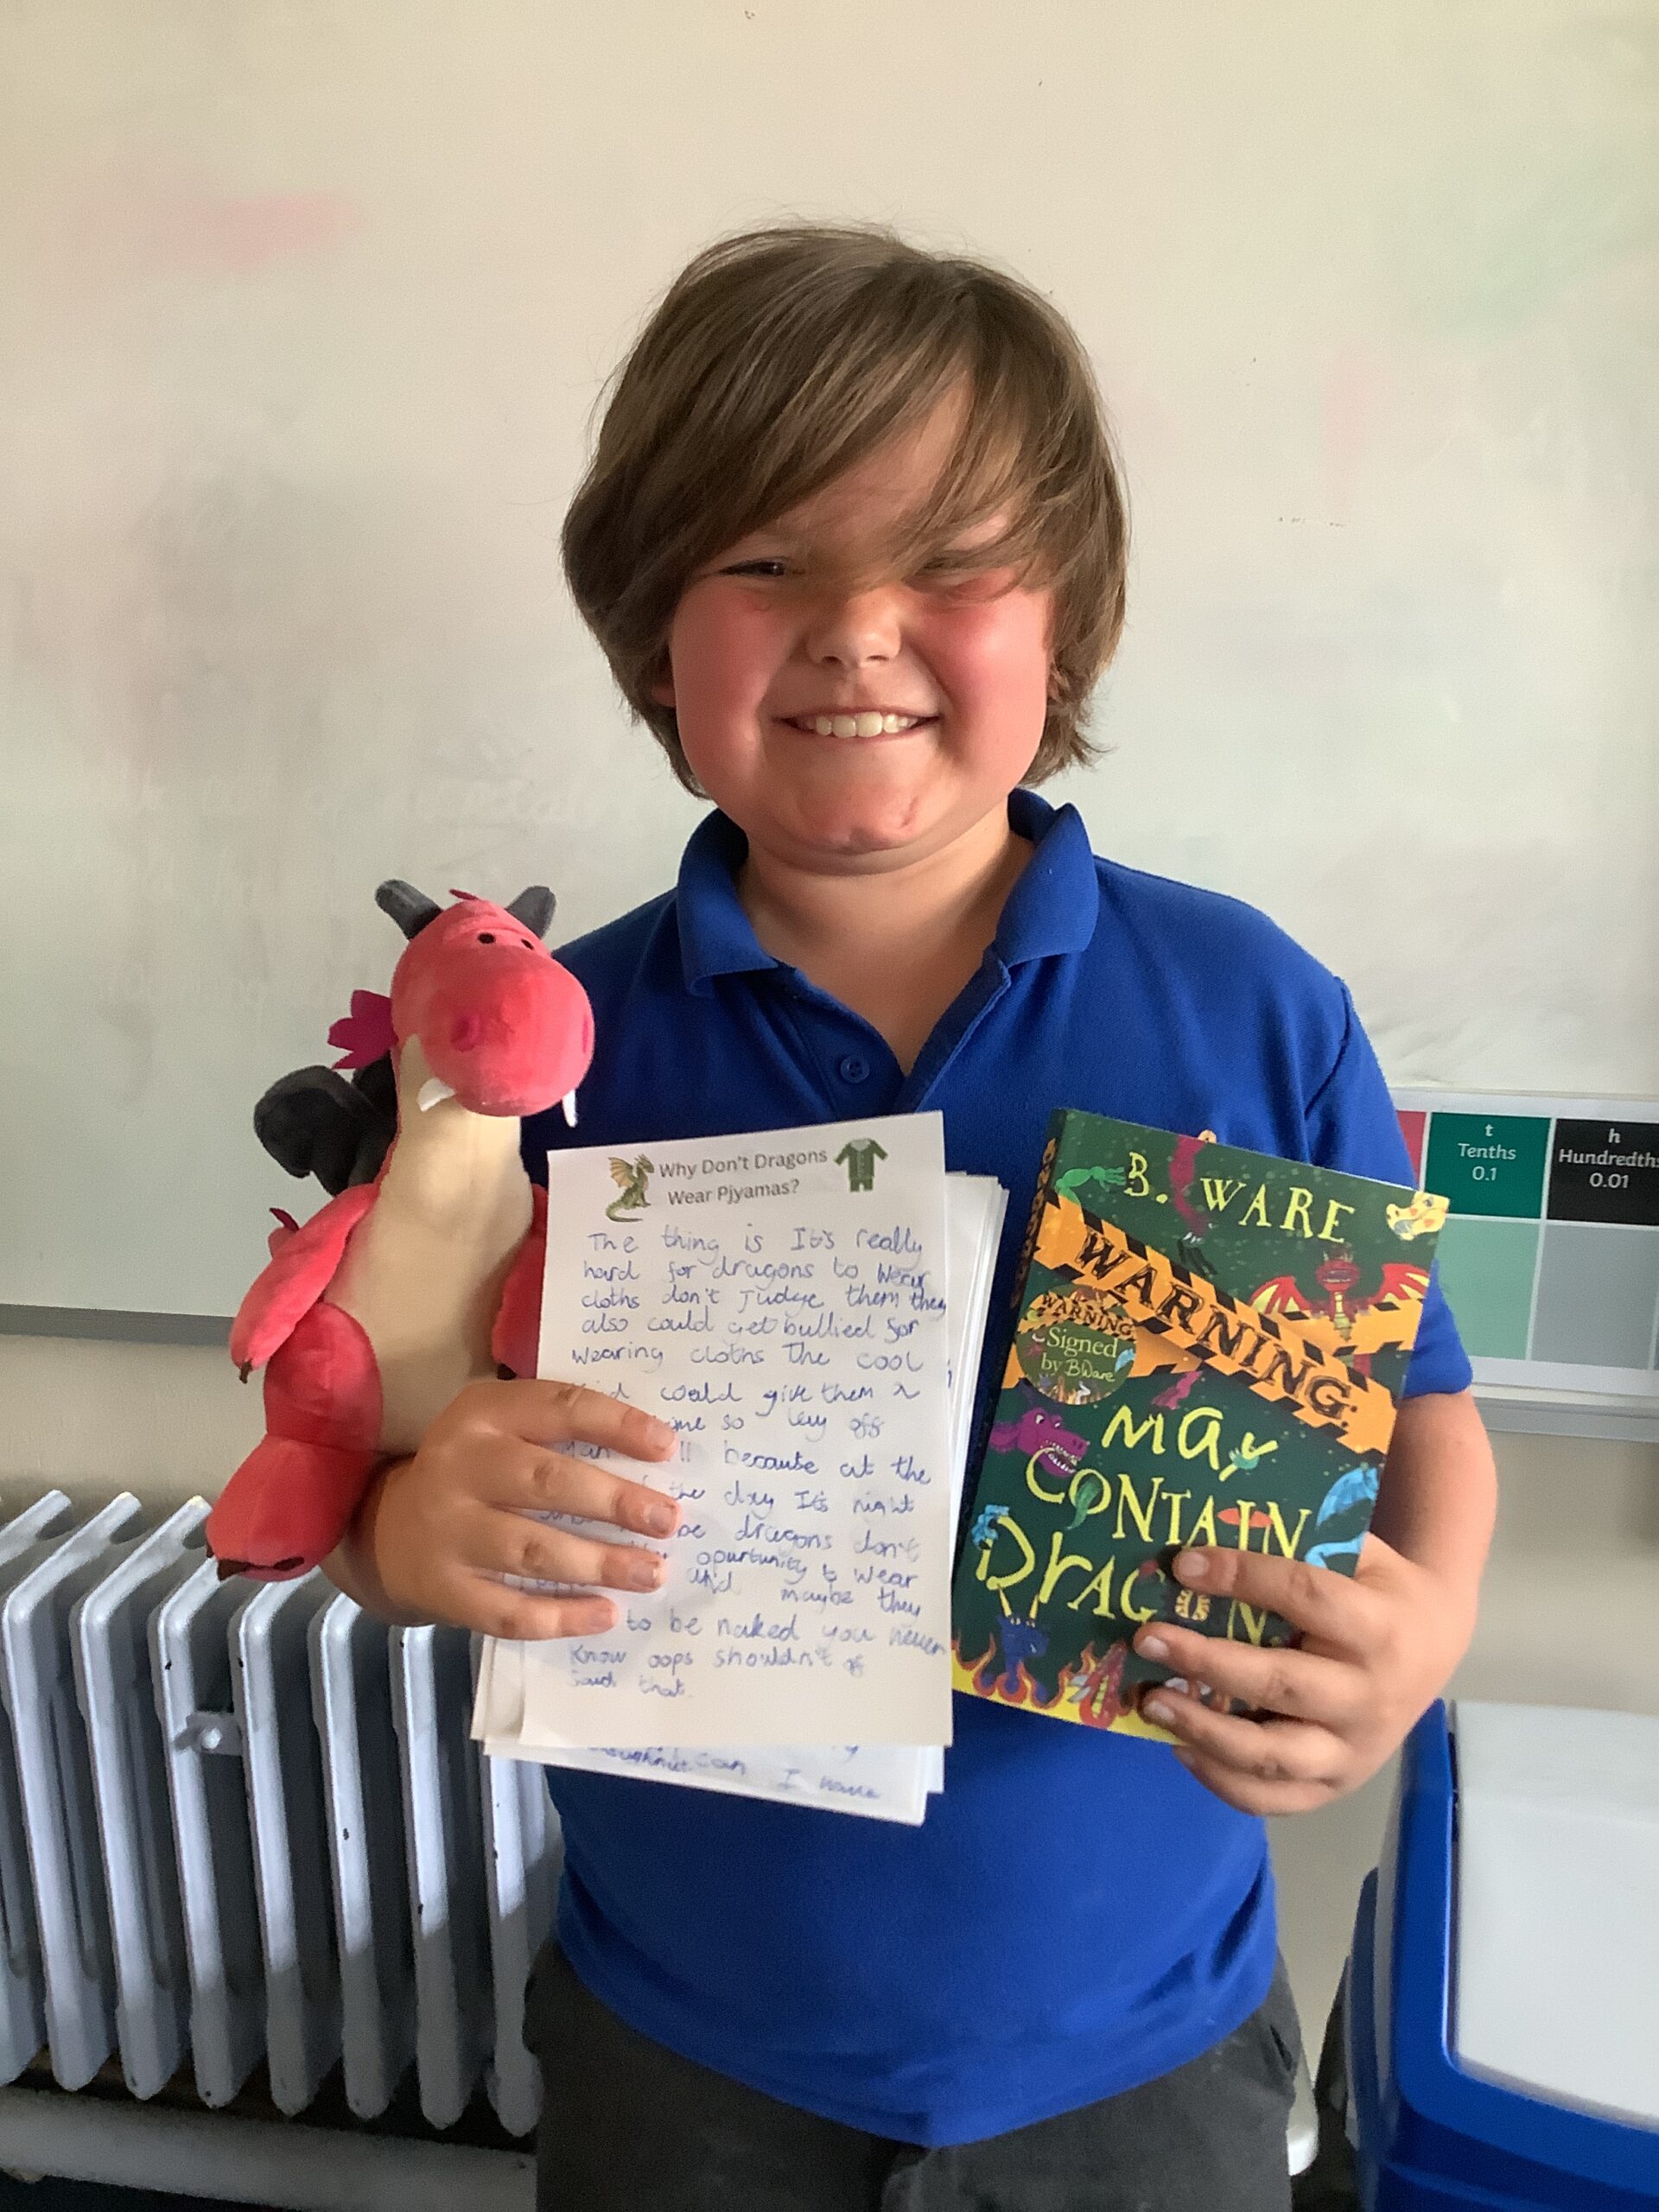
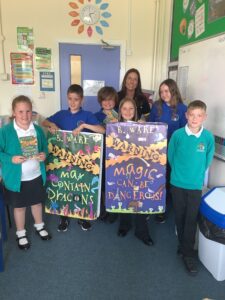
We had such a fabulous day when author B. Ware came to visit Abbey Park. She read us some of her new book and many of us were lucky enough to take part in her workshops which encouraged us to write and illustrate our own novel ideas. What a great day!
Lumi Nova: Help your child build confidence and self manage worries with a fun mobile game.

Feedback request!
Have you been using Lumi Nova to support your child to overcome their fears and worries? If so, the Lumi Nova team would love to hear from you. Your feedback will help the service continue to develop and support more young people to build their resilience.
Your feedback will be anonymous unless you choose to leave your contact details.
If you are interested in using Lumi Nova you can do so for free following the instructions below:
What is Lumi Nova?
Lumi Nova is an intergalactic adventure game to support young people to fight fears and manage worries. Watch this short animated video to learn more: Lumi Nova Introduction Video
Who can use Lumi Nova?
Lumi Nova was created for 7 – 12 year olds (school years 3 – 7) who are having difficulties with fears, worries, or anxiety related to social situations, separation or phobias.
How do you access Lumi Nova?
Accessing Lumi Nova is quick and easy. Use the link below to register and you will receive a text message to guide you through getting started.
To find out more visit luminova.app or join a Parent Information Webinar.
Poetry Competitions
There are two poetry competitions open for your children to enter.
One is run by Severn Arts and the title this year is ‘Courage’. Your children can enter this direct through the following website:
https://www.severnarts.org.uk/ypl25
The second competition is run by Young Writers Wonder Verse and children will enter through the school. Details can be found here: https://www.youngwriters.co.uk/competitions/primary-7-12/wonderverse25
Prizes to be won and your child could even end up being published!
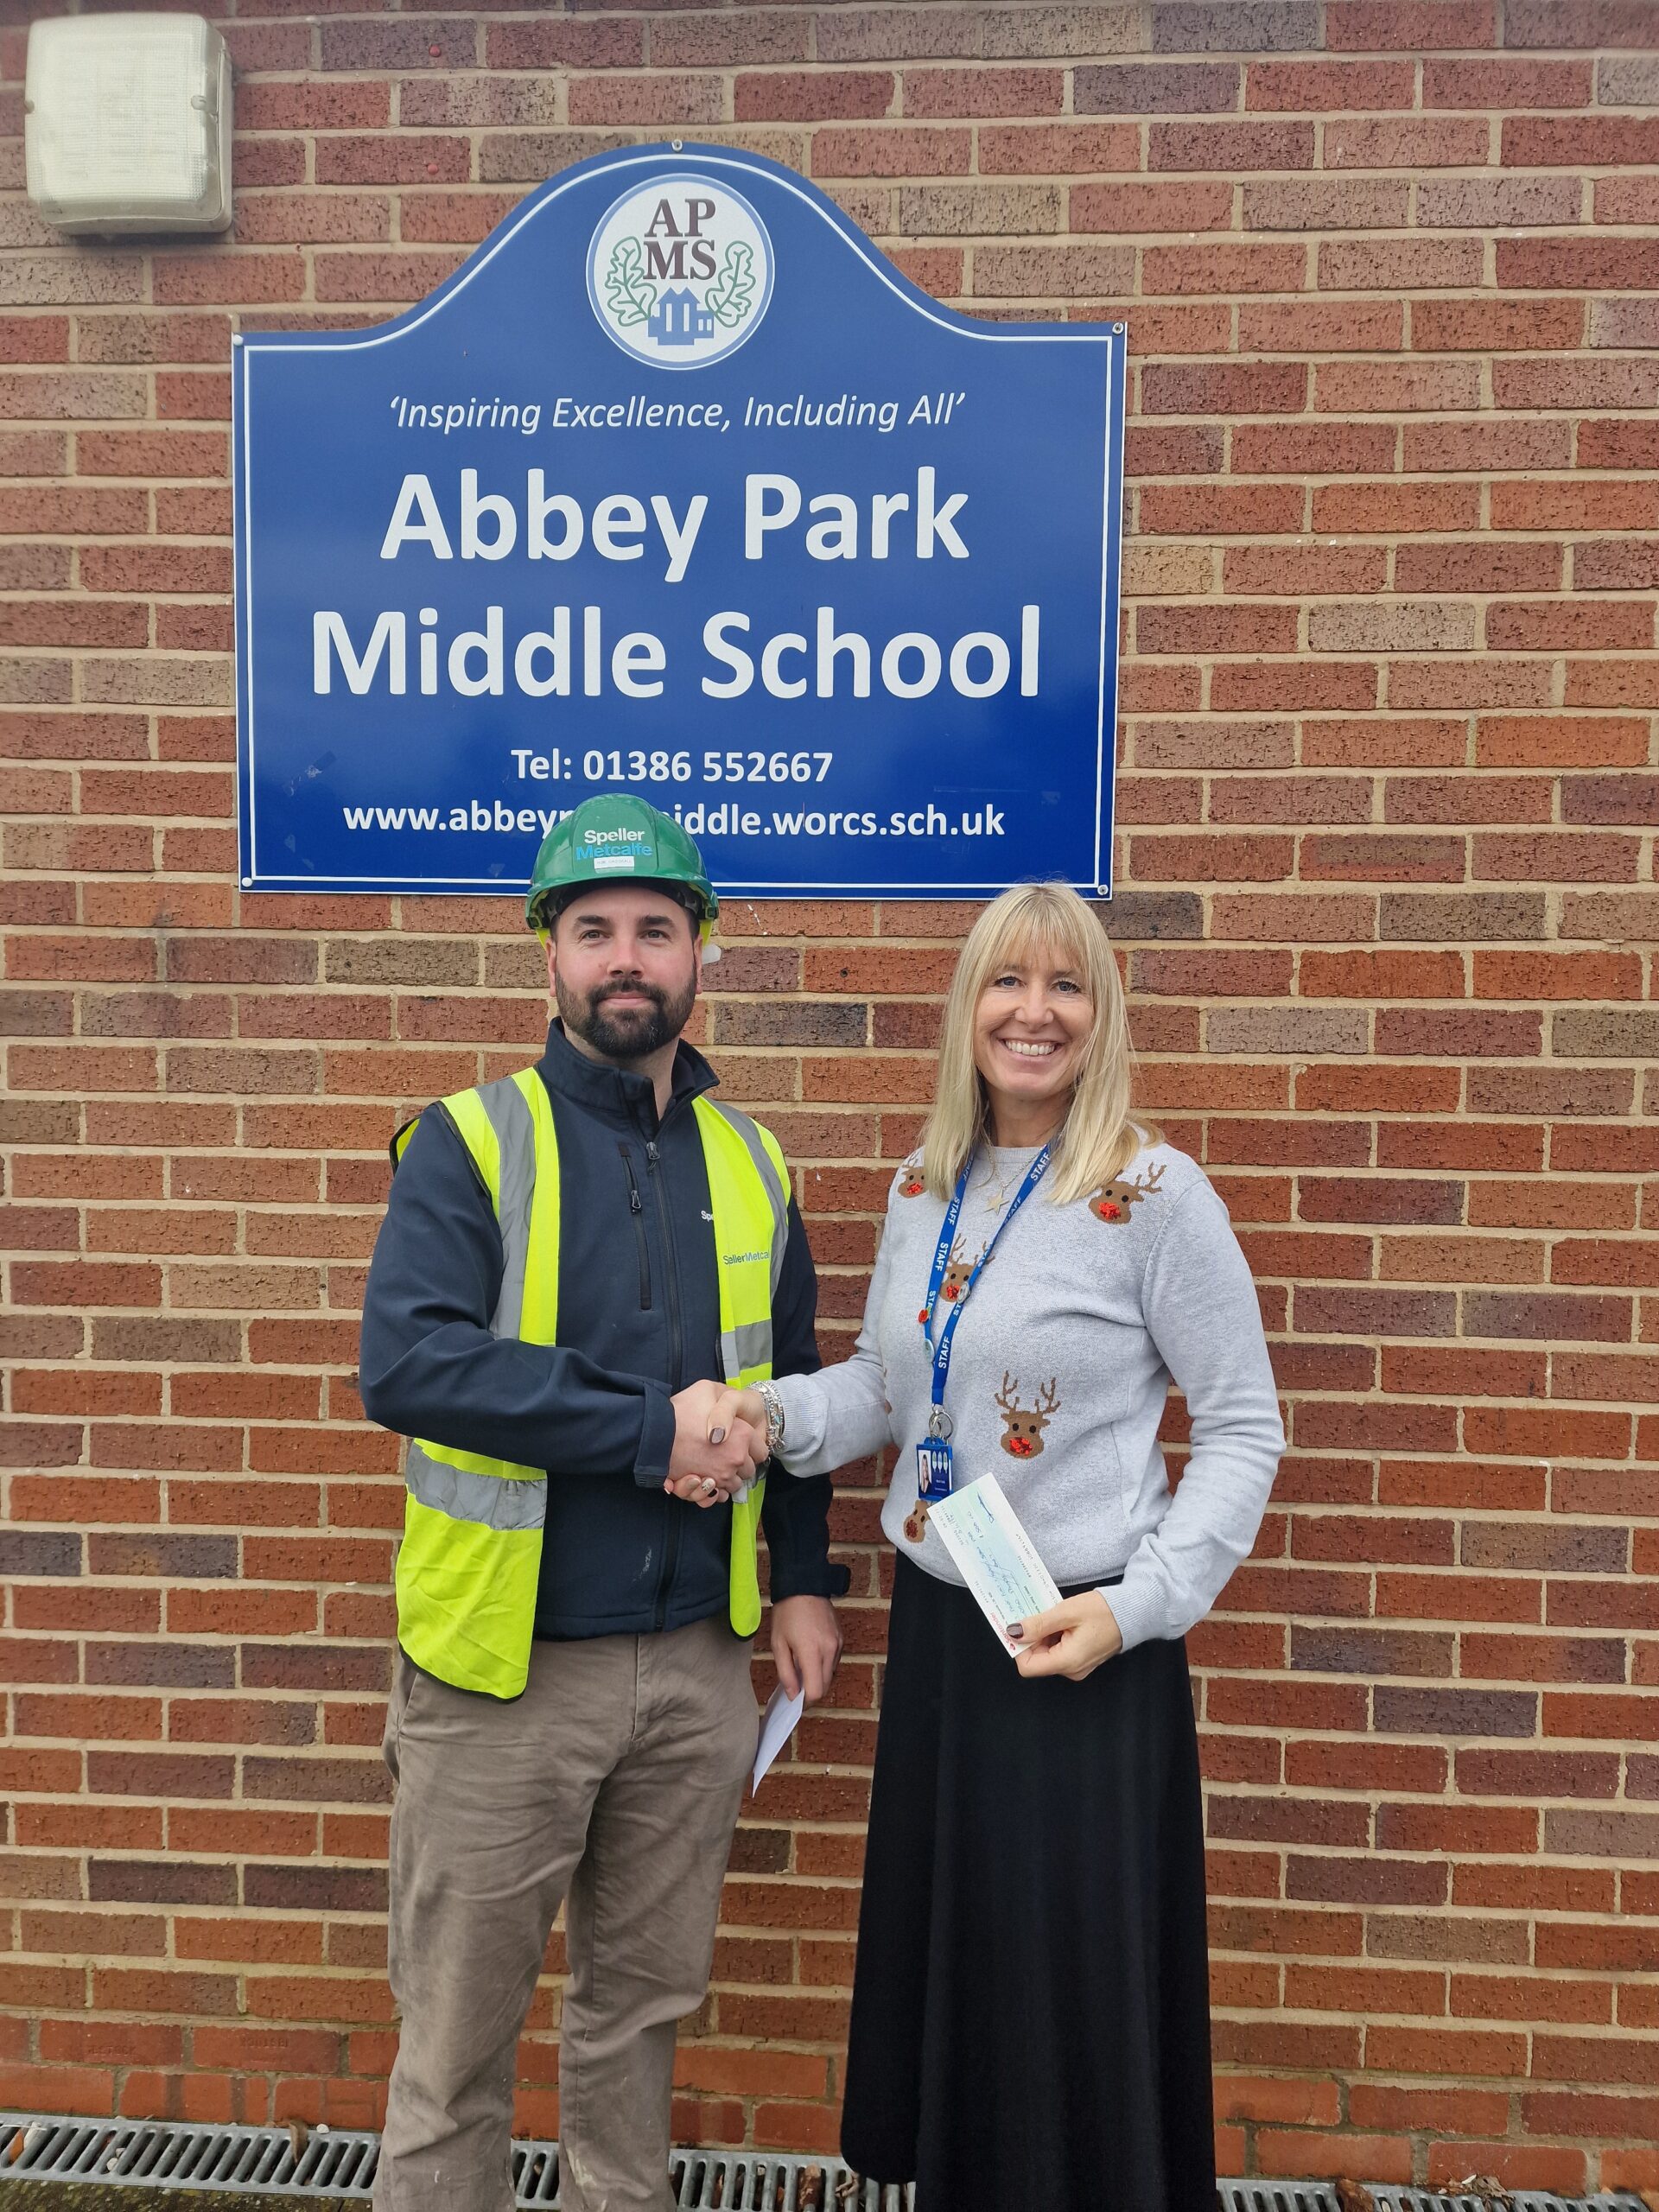
Speller Metcalfe have made a £500 donation to the PTFA and have thanked the school for their support and cooperation during the rebuilding of Almonry Close.
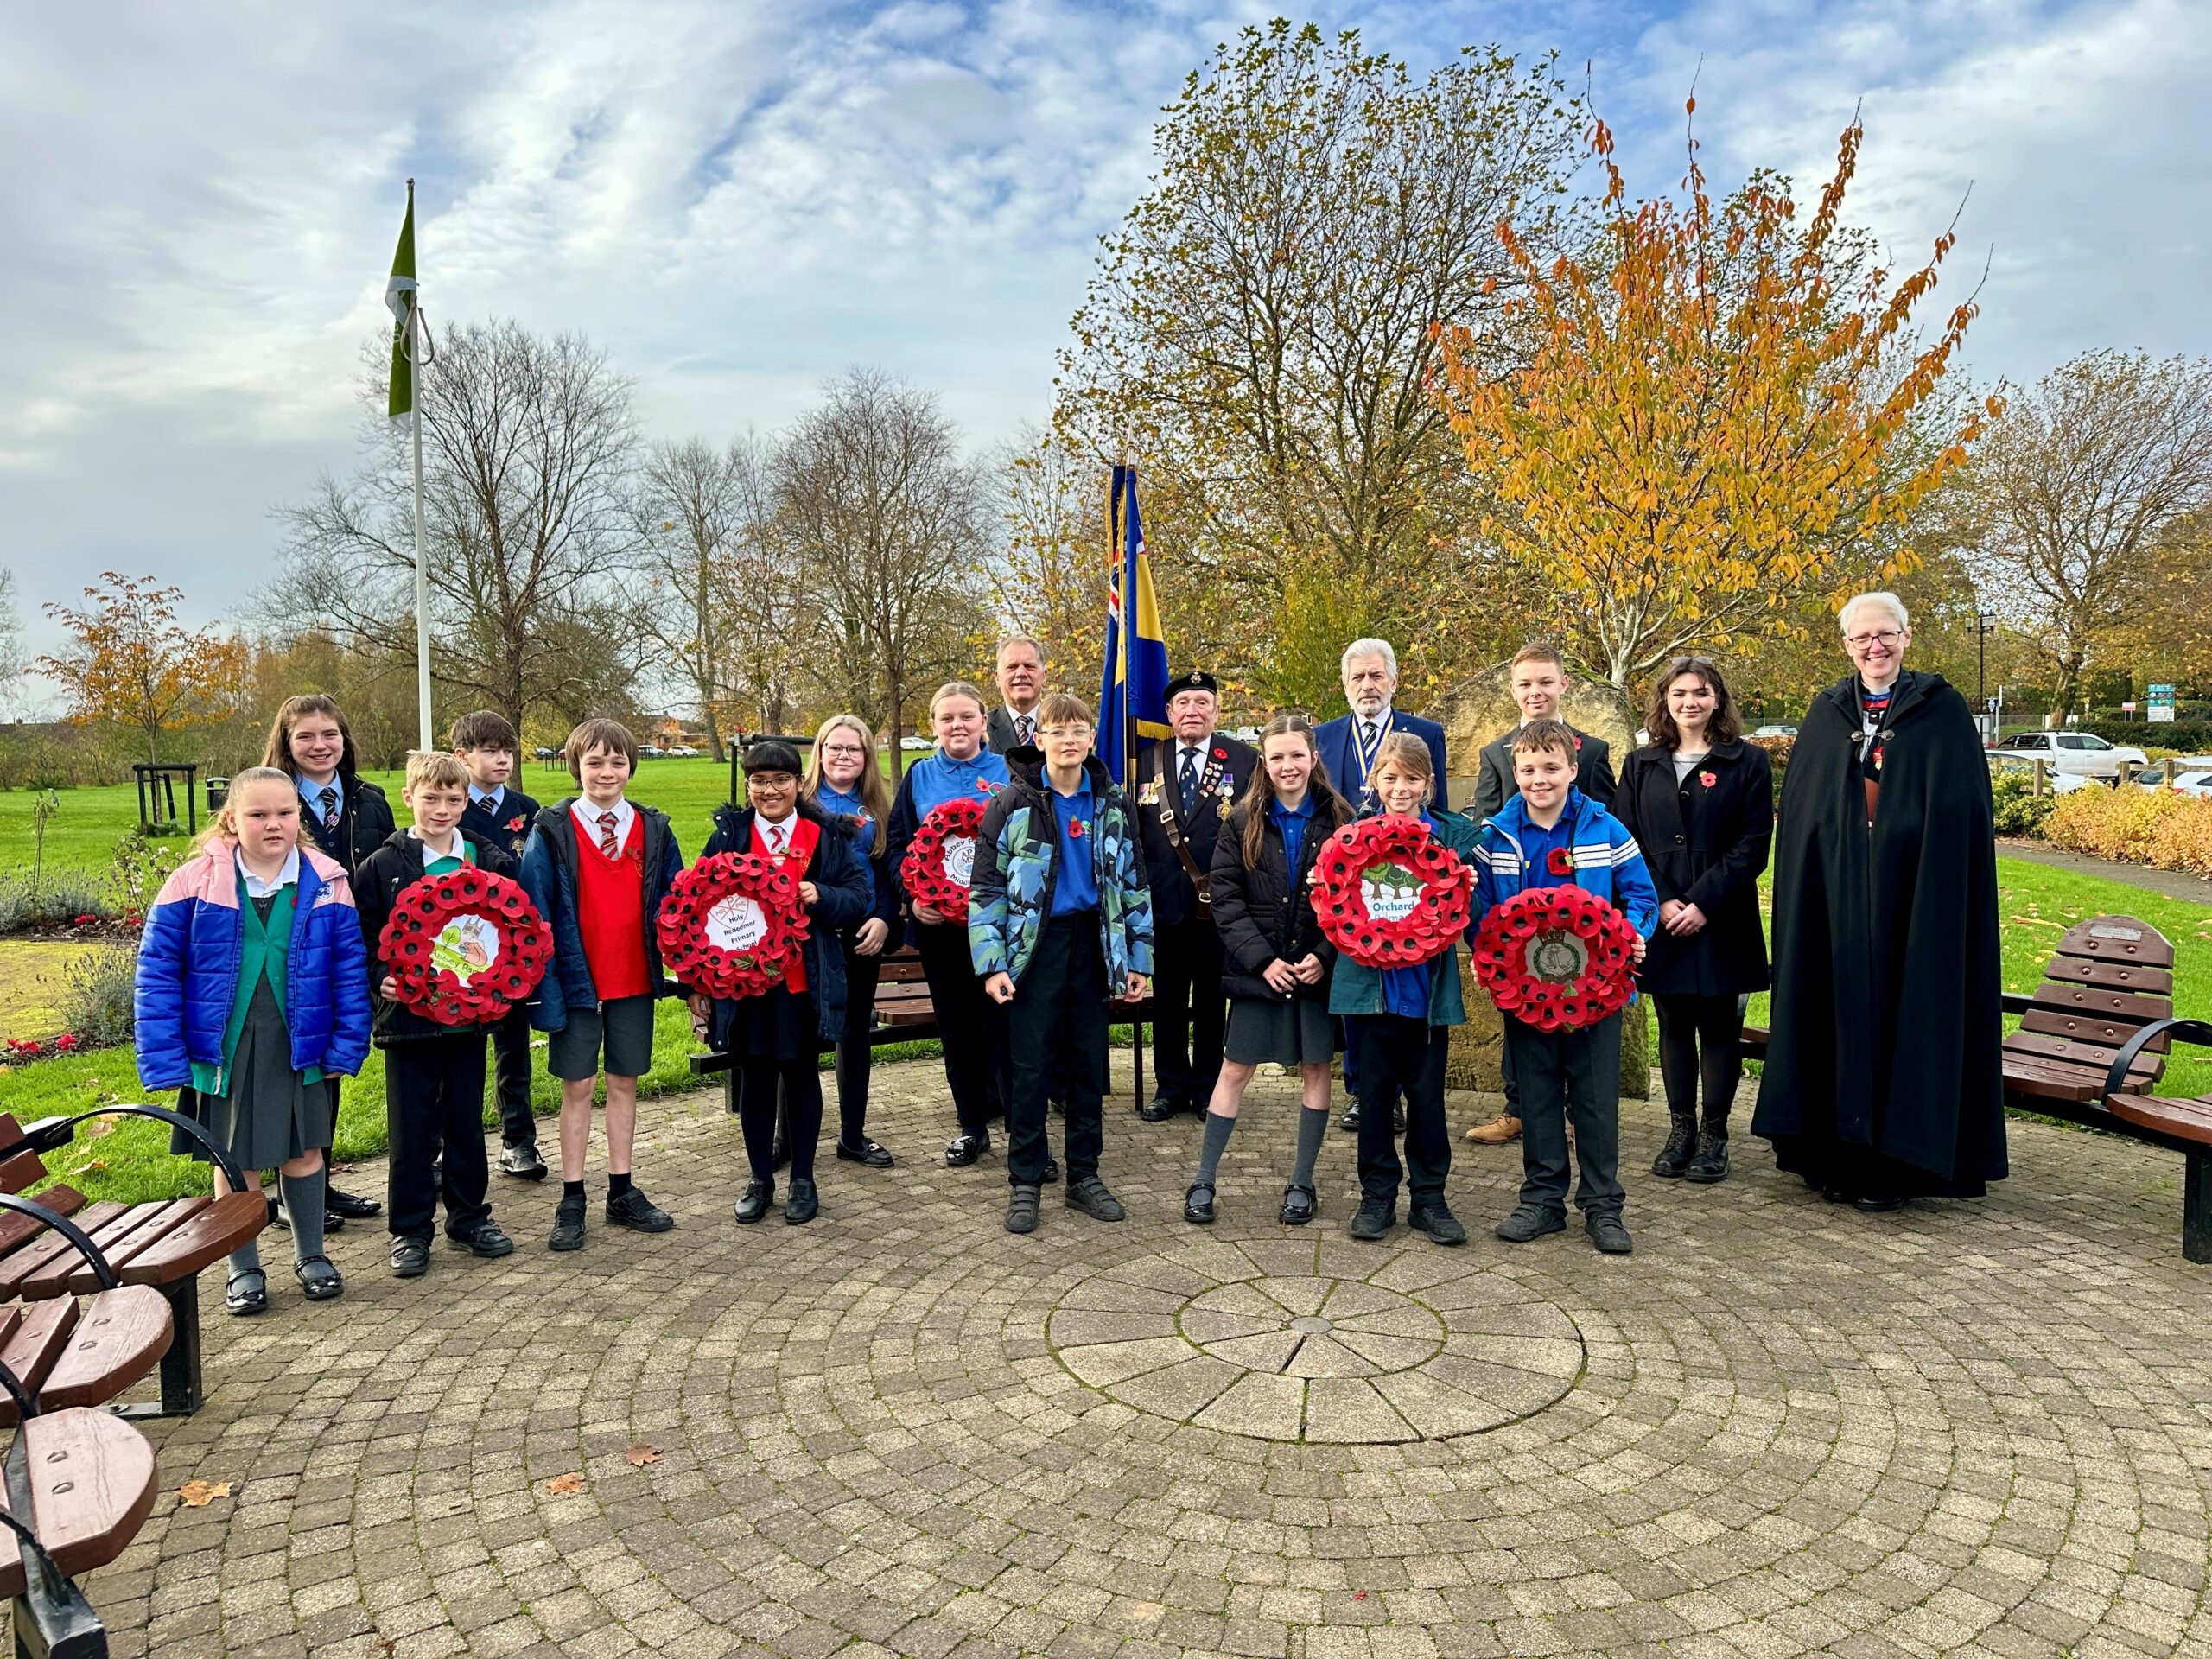
Armistice Wreath Laying Service

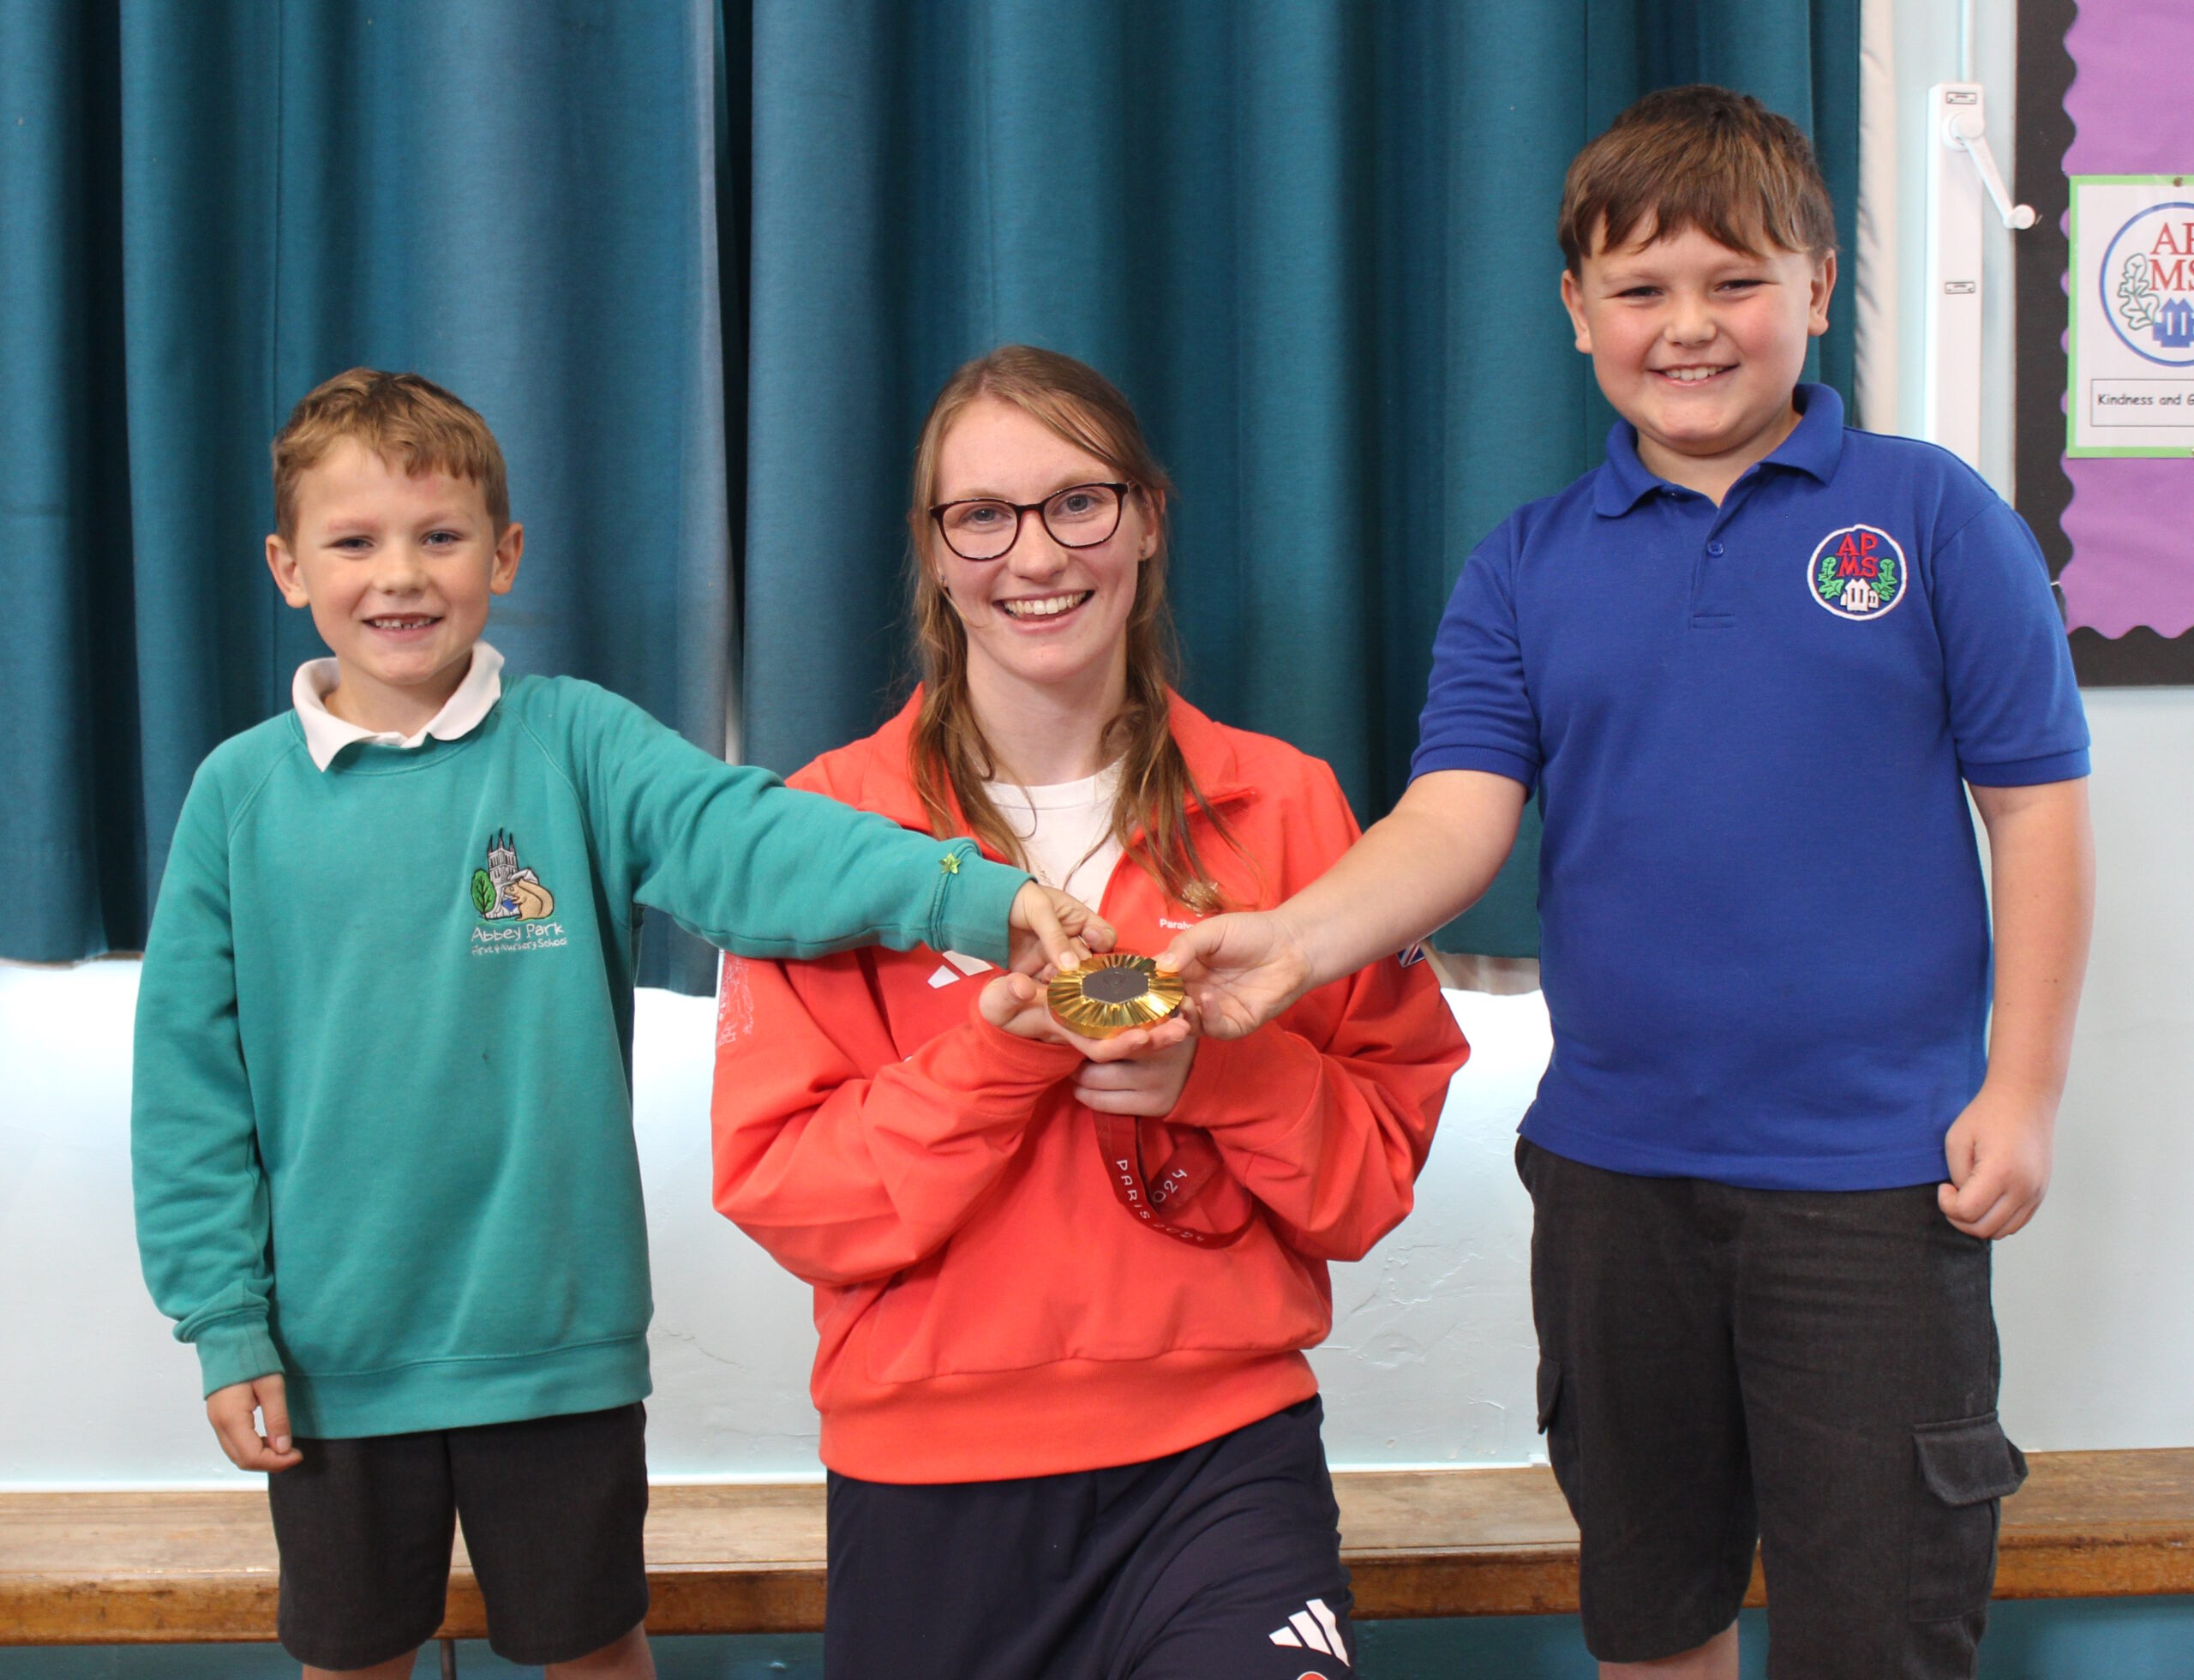
Rebecca Redfern
We were honoured to receive a visit from Rebecca Redfern, Paralympic Gold Medallist, who came in to talk to the Federation about her life and achievements. She talked about her disability and how she refused to let it stop her from following her dreams. She brought her Rio and Tokyo Silver medals and her Paris Gold medal with her for the children to see up close, and some even had chance to hold them!
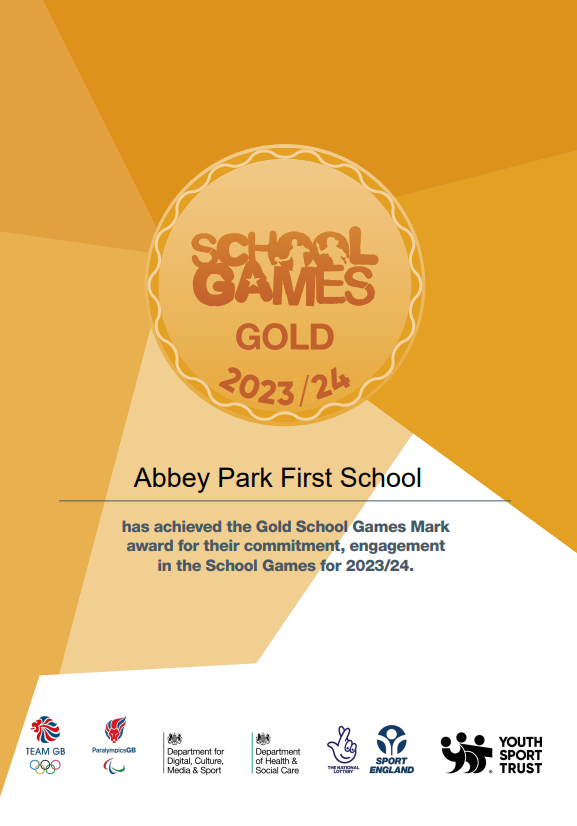
Abbey Park First School Get GOLD
We are delighted to announce that we, Abbey Park First School, have achieved the School Games GOLD Mark Award for the 2023/24 academic year.
The School Games Mark is a Government-led award scheme launched in 2012, facilitated by the Youth Sport Trust to reward schools for their commitment to the development of competition across their school and into the community, and we are delighted to have been recognised for our success.
Our sporting achievements this year include:
Increased physical activity at break and lunch times
Active after school clubs
Lots of inter-school competitions
Lots of intra-school competitions
Boogie Bounce
Sports Day
Thrills Day
Football tournaments
Multiskills festivals
Cricket competitions
Bellboating
Athletics colour run day
With a huge amount of young people competing in local inter-school competitions this year, we are extremely proud of our pupils for their dedication to all aspects of school sport, including those young volunteers, leaders and officials who made our competitions possible.
As part of our application, we were asked to fulfil criteria in the areas of participation, competition, workforce and clubs, and we are pleased that the hard work of everyone at our school has been rewarded this year.
A special thanks to all children and staff who have made this possible for us!
We look forward to applying once again in 2025!
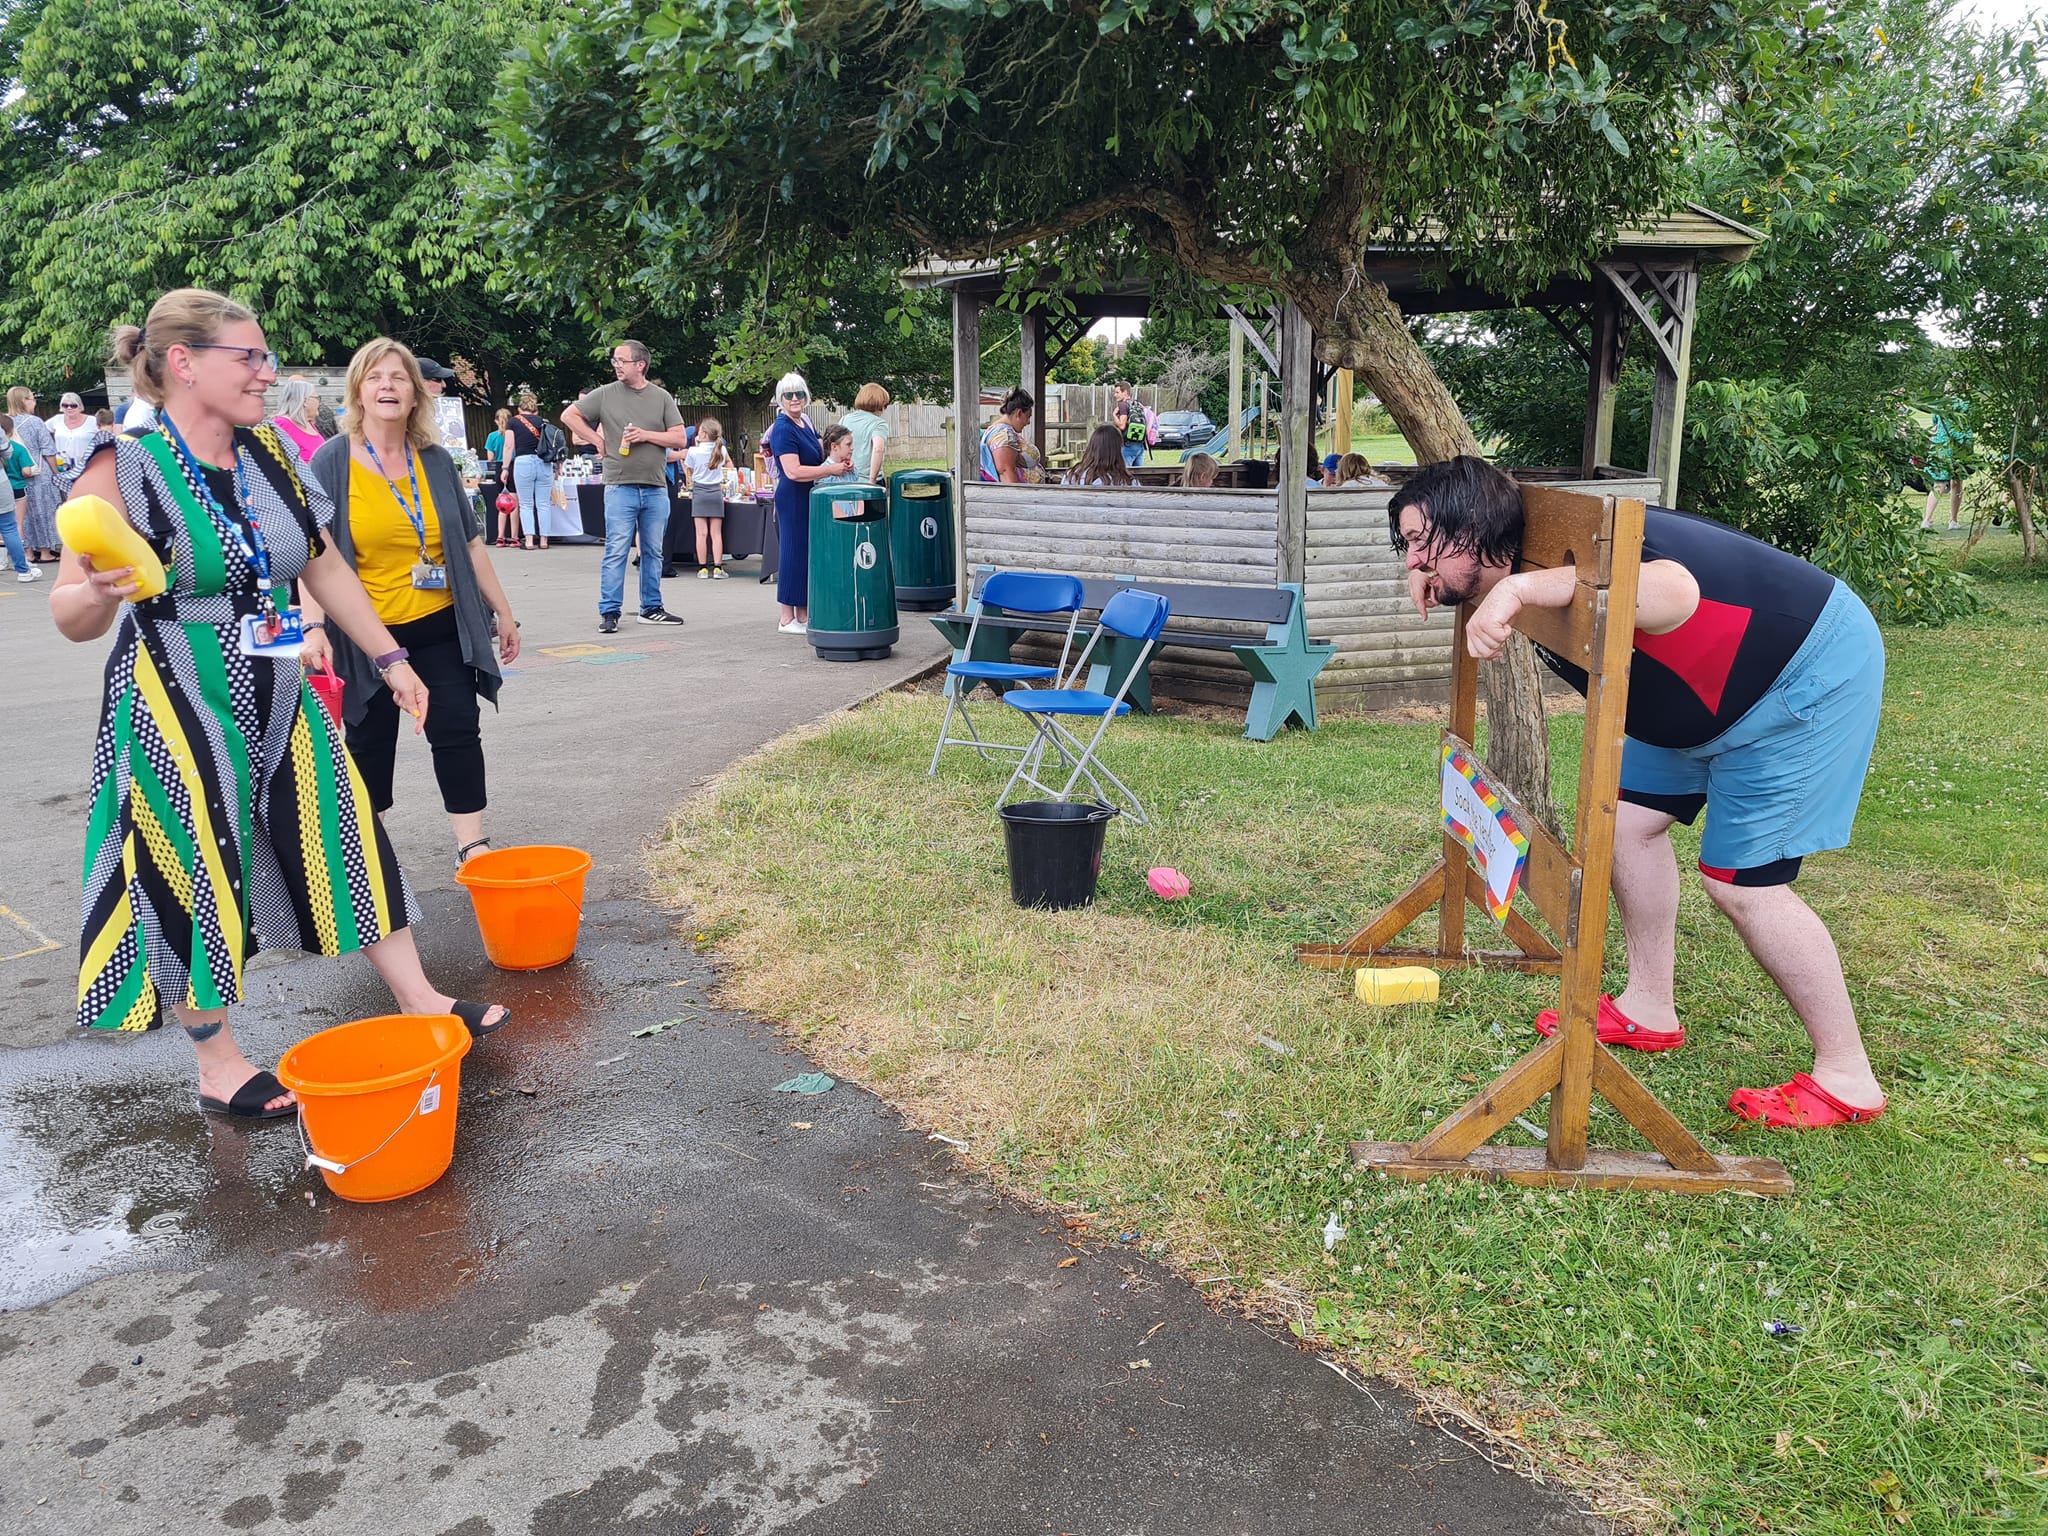
On Friday 28th June we held our annual summer fair!
It was a great success and everyone had lots of fun, most of all Mr Henry!
Lots of families came and enjoyed our event with stalls, inflatables, food trucks and face painting!
A huge thank you to everyone who supported us and everyone who volunteered to help too!
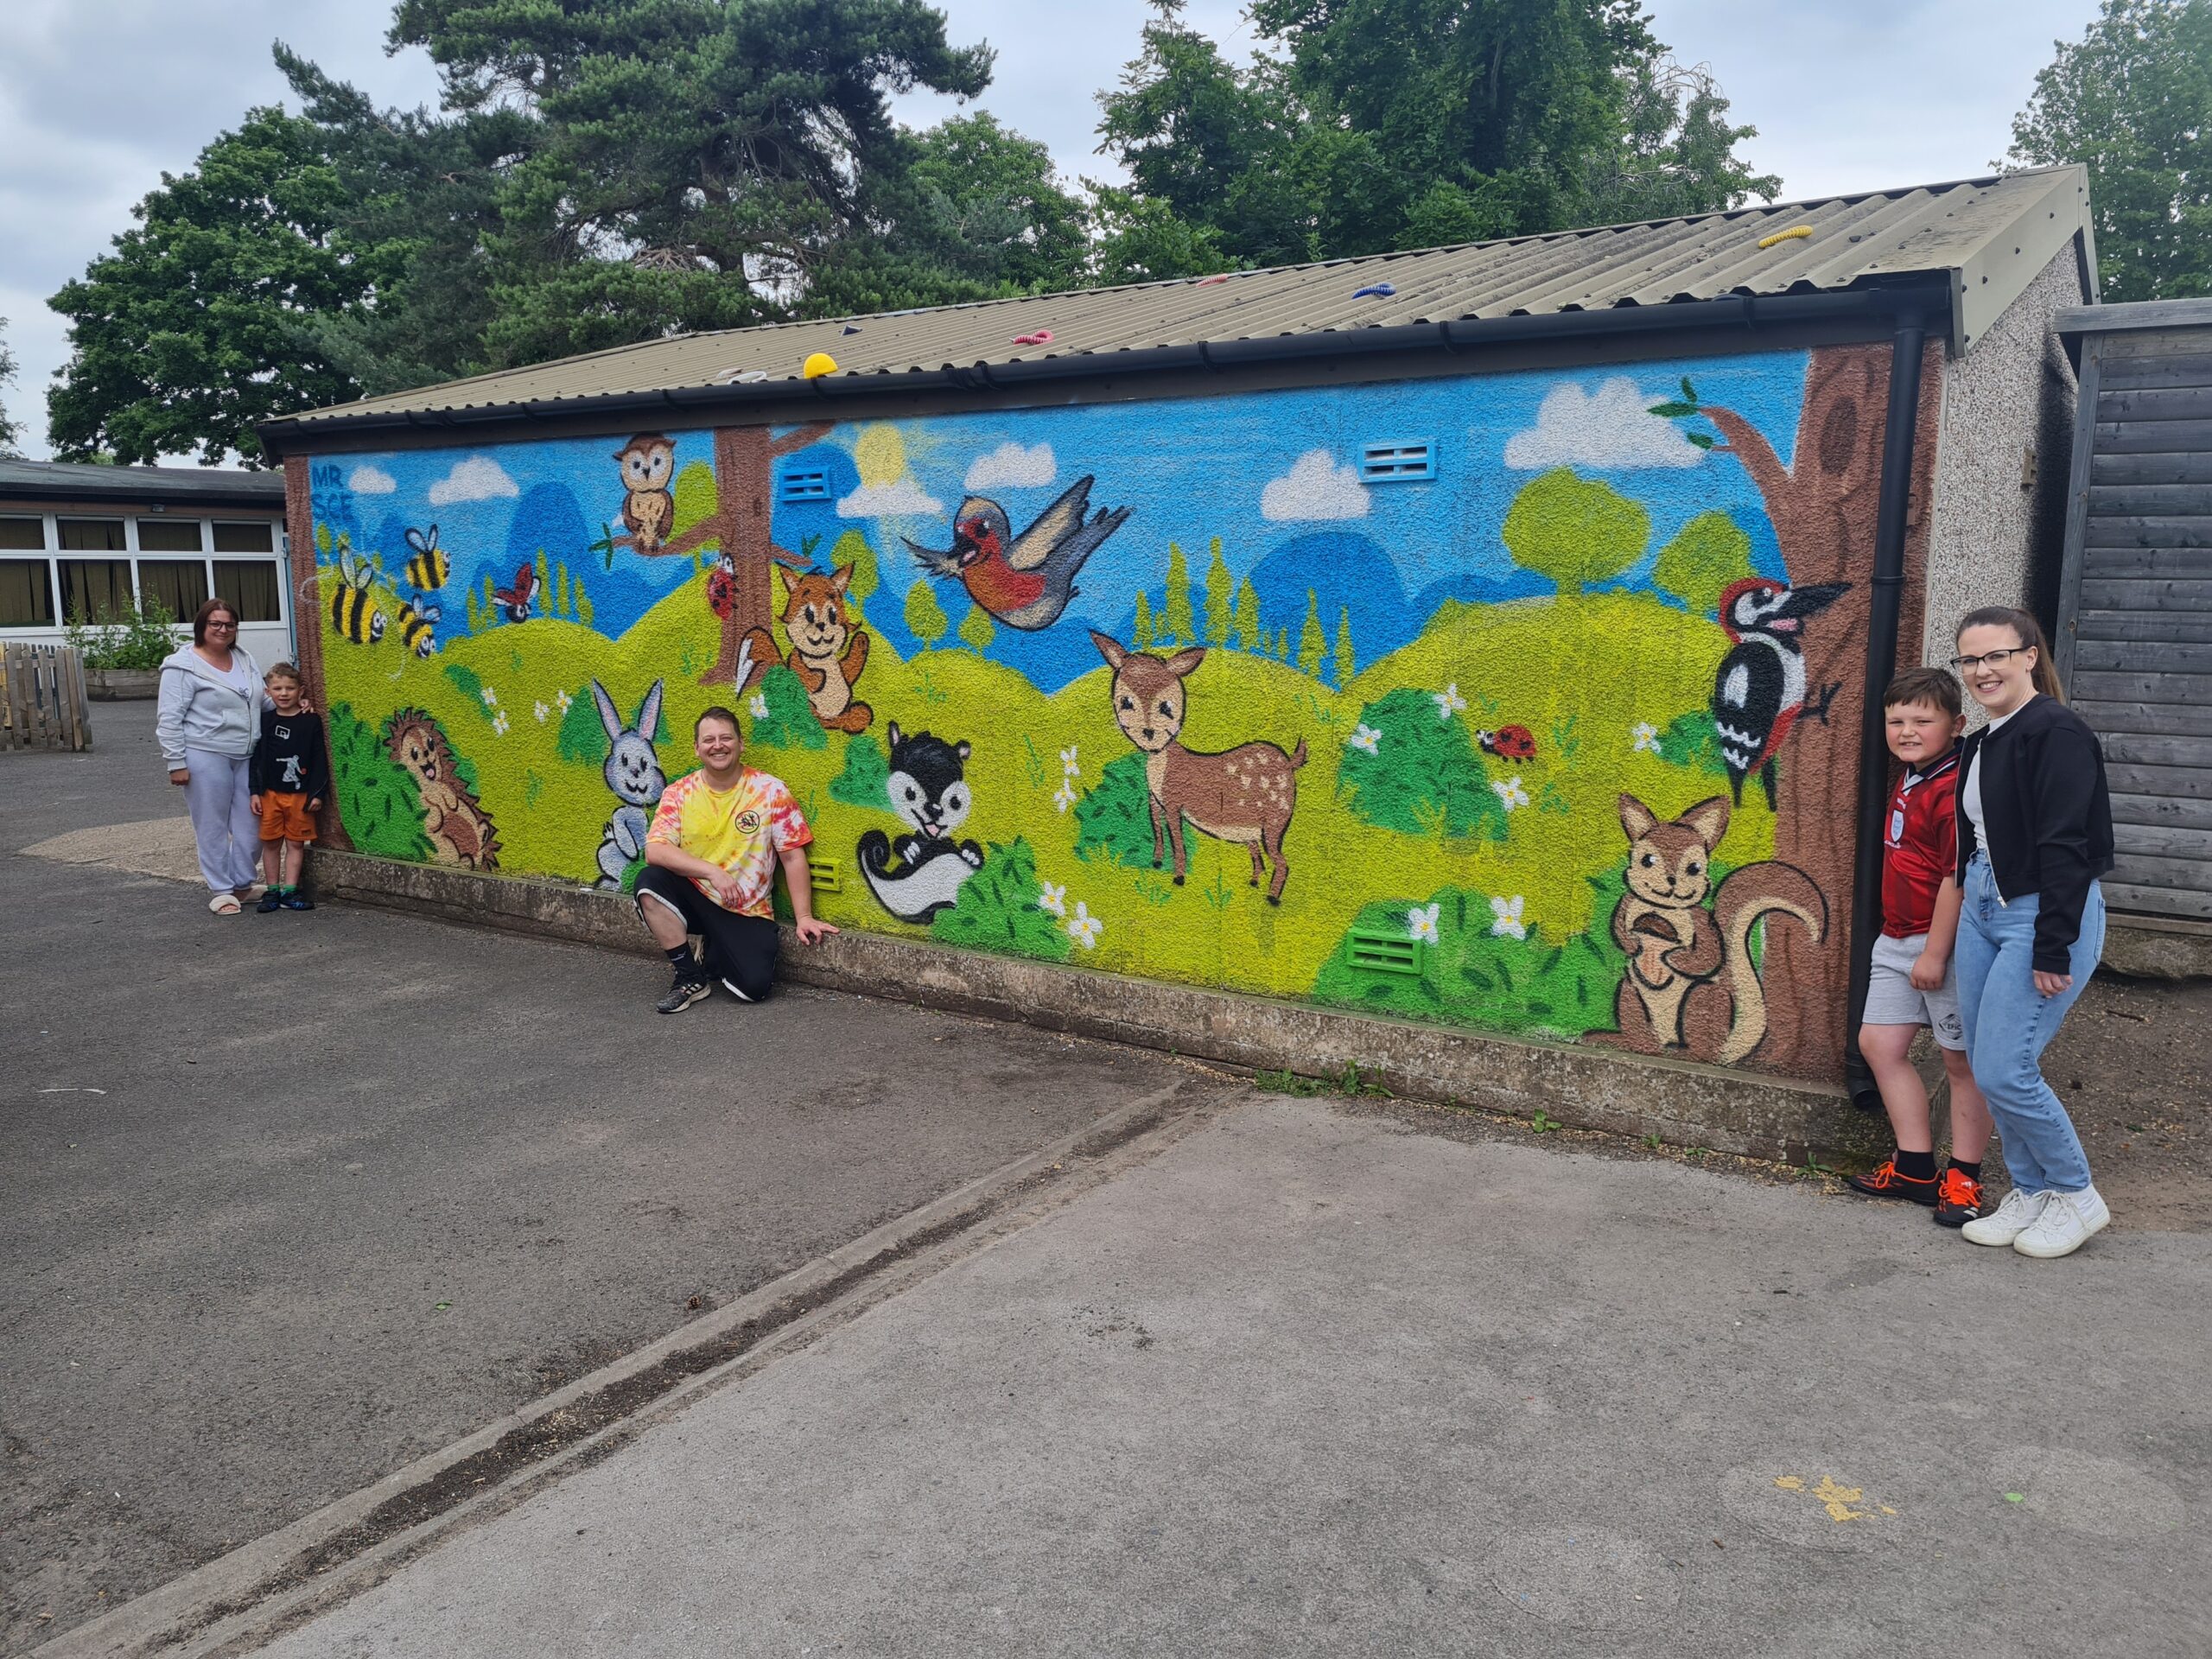
The PTFA are working hard to improve our outdoor areas. Recently they have been working with some fantastic volunteers at our forest school club to transform our forest school areas, with more improvements still to come. They have also bought plants for the planters around the first school playground, and, very excitingly, they have arranged for a beautiful new artwork on the side of the garage at first school. Painted by Mr Sce, it incorporates all the animals our classes are named after. Find out more on the PTFA page.
We are thrilled to confirm that Miss Scully was awarded ‘Headteacher of the Year 2023’ at the Worcestershire Education Awards that took place last night at The Abbey Hotel, in Malvern.
We are so proud of her achievement and feel this confirms her outstanding support and commitment to our pupils and families at Abbey Park Schools Federation.
Well done Miss Scully, you are the best!
A message from the Executive Headteacher
Abbey Park Federation of schools caters for children aged 2 to the end of year 7 (age 12). We do this across our pre – school, nursery, first school and middle school. We have a spacious site opposite the Abbey in the beautiful town of Pershore.
Children across the Federation are taught by inspirational, passionate staff that are relentless in their drive to ensure children make progress and are happy in their learning. All children are appropriately challenged at their level and experience a rich, varied curriculum with many enrichment and extracurricular activities.
Children in the first and nursery school are class based and taught through an exciting topic led curriculum. Children join the middle school at the beginning of year 5. Children in years 5 and 6 spend approximately half their school day with their class teacher and the rest with specialist staff. Children in year 7 are taught in a secondary style.
Children across the Federation benefit from specialist areas such as the science laboratory, the design technology and cookery suite as well as a dedicated ICT suite.
Abbey Park prides itself on excellent pastoral care where all staff work closely with parents / carers in ensuring all children are ready and happy to learn. The school encourages parents / carers to discuss their children’s needs whenever needed.
I am really proud of our schools and the care our children receive; I am very happy to show any prospective families around our site – please do get in touch.
Rebecca Scully
Latest News
View all
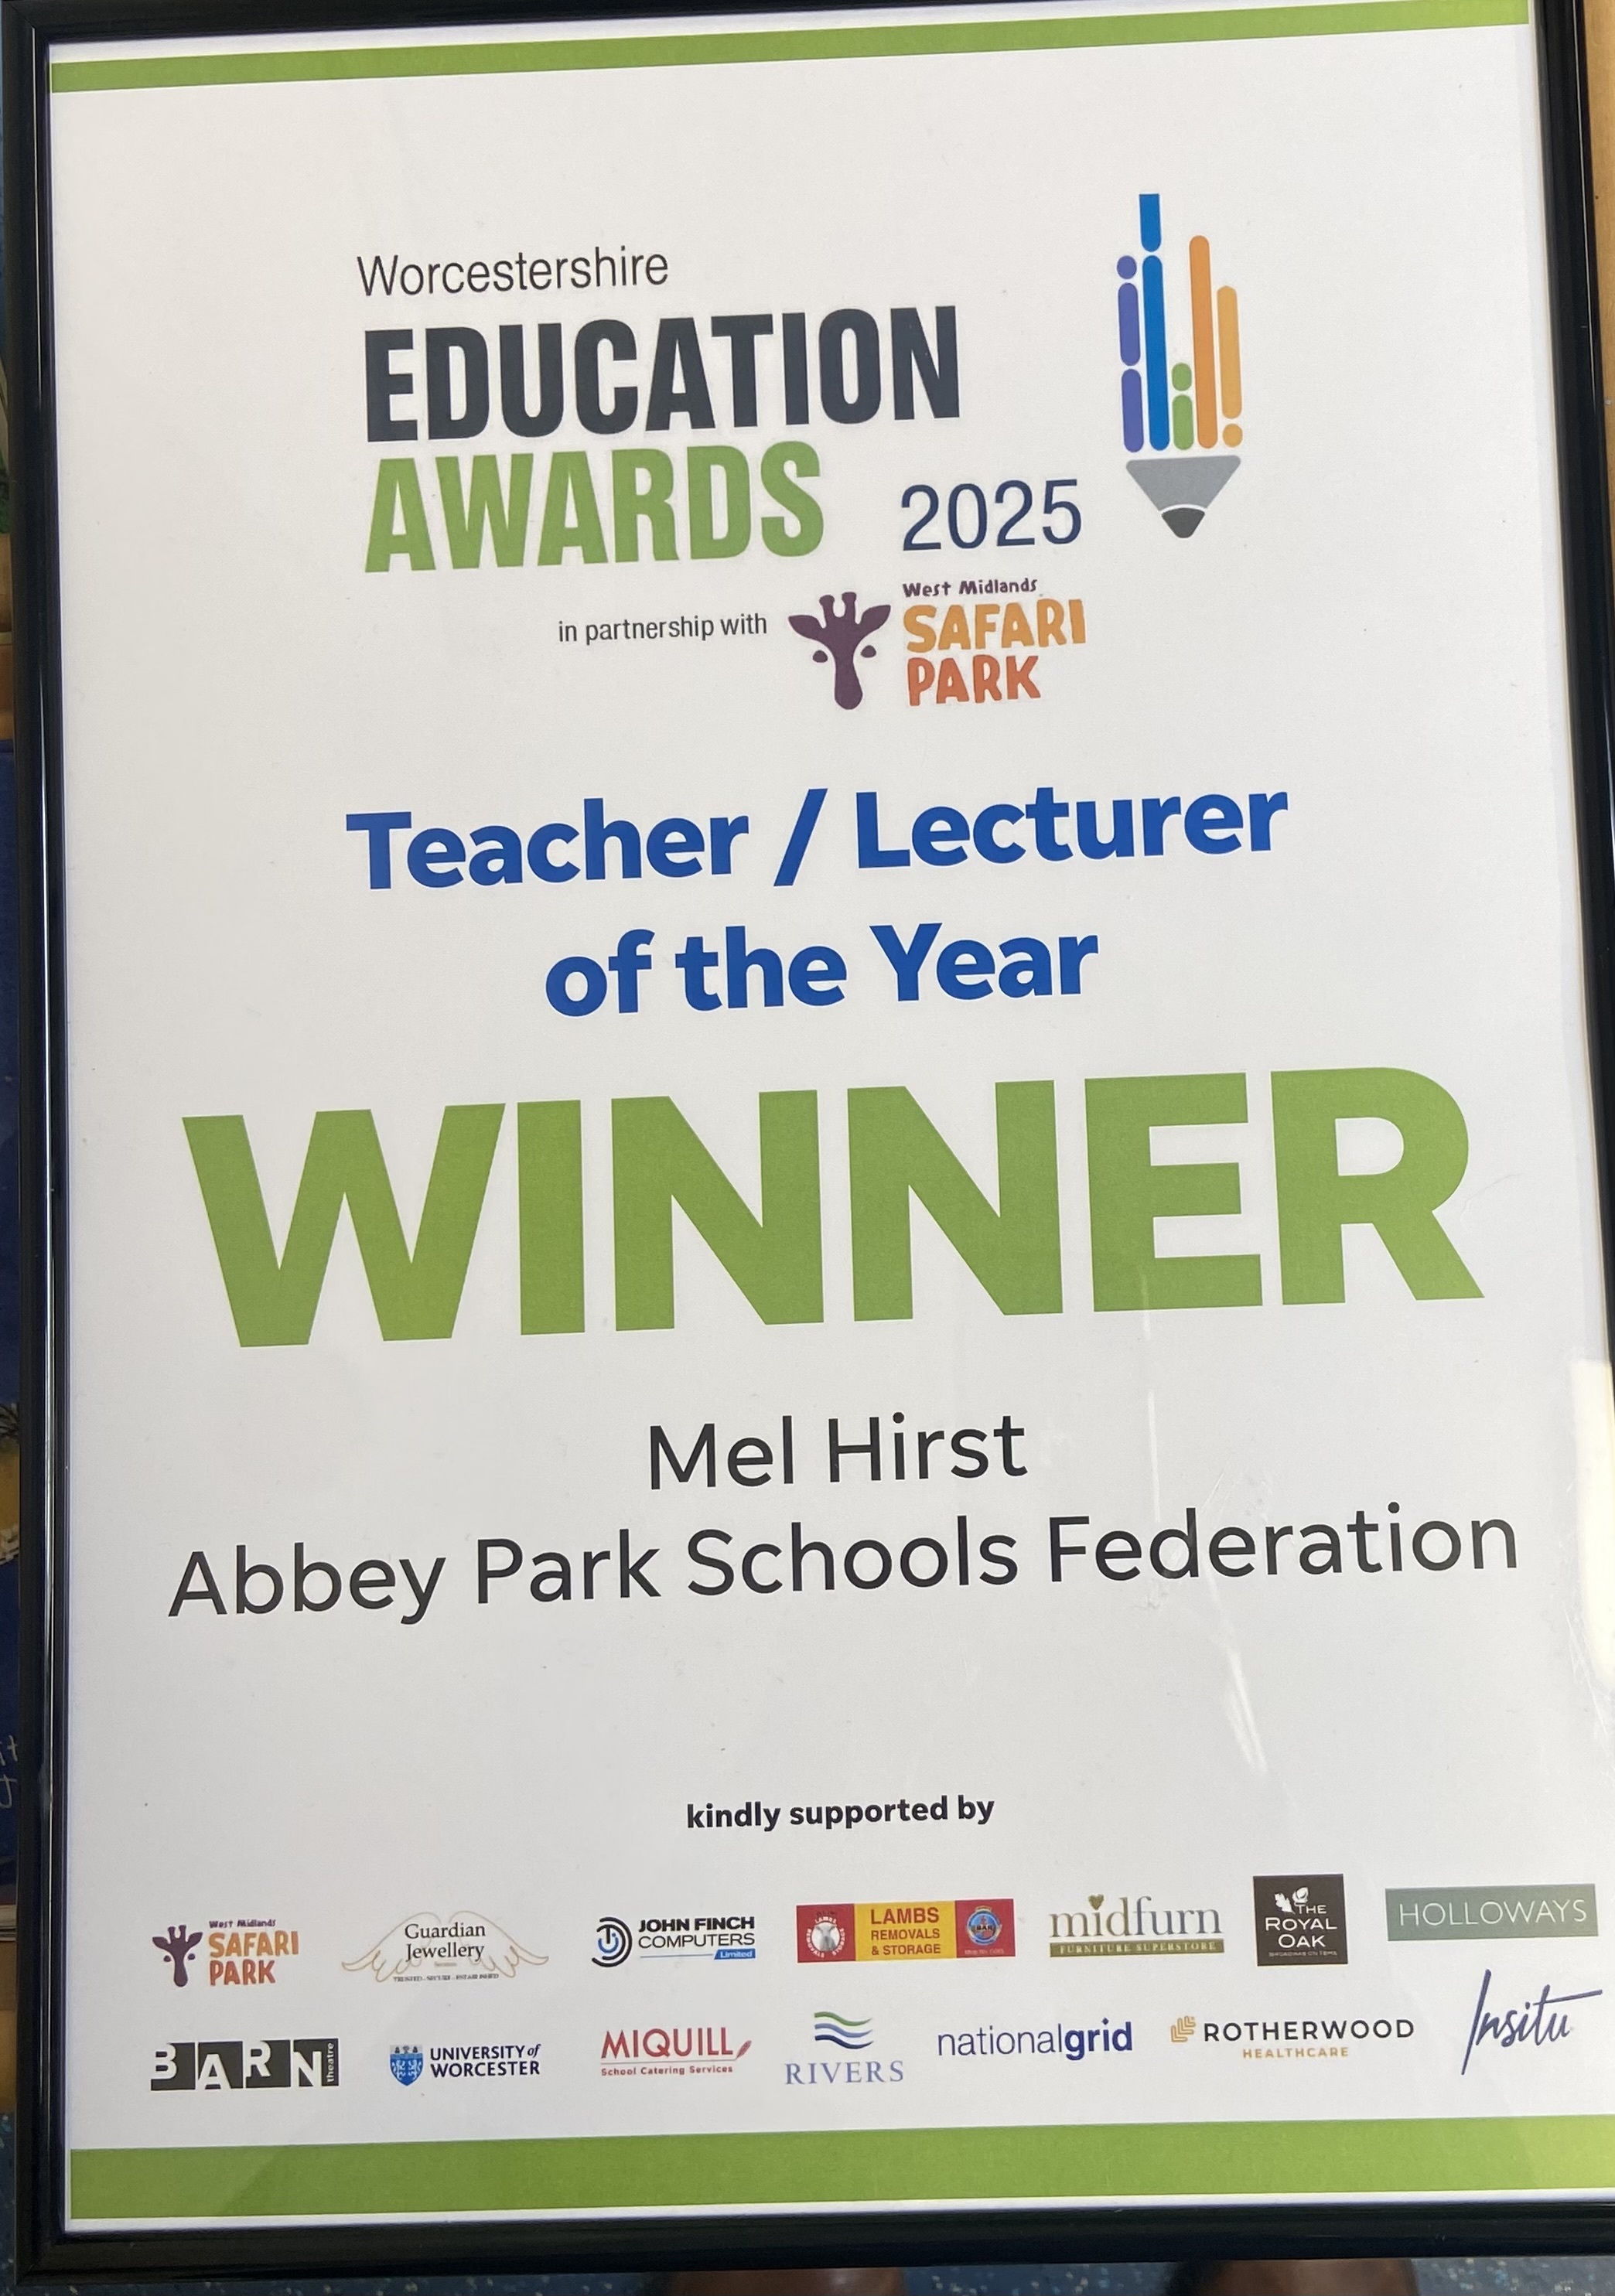
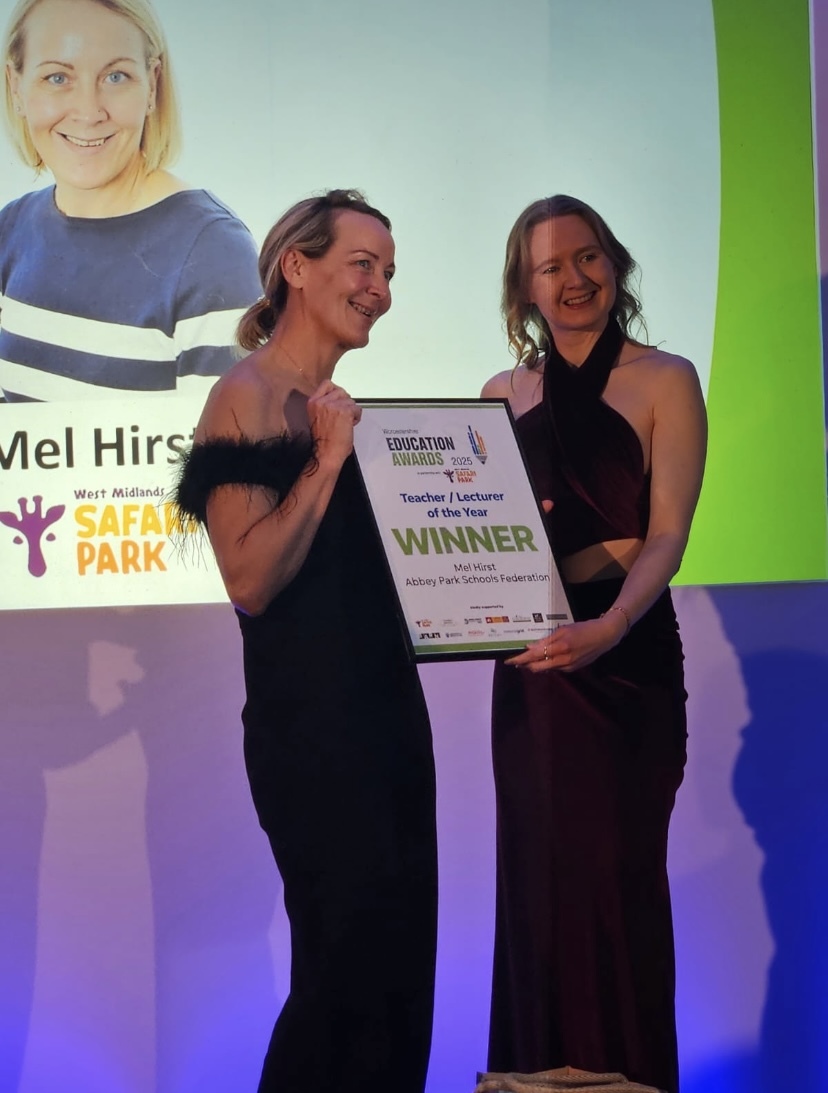
We are delighted to announce that Miss Hirst has won the best teacher/lecturer of the year award at the Worcestershire Education Awards. Congratulations Miss Hirst, we are so proud of you.


Latest events
View allSummer Fun Event for our Pre-School, Nursery and Reception children and their parents/family members.
Early Years Summer Fun Event
July 16th, 2025